I like to visualize data! Its easier to understand and relate that way. Its a good way to memorize key points.
It was back in the tail end of 2014 that I thought of representing some hierarchies by drawing boxes in Fireworks. But this would not be easy to maintain and edit easily.
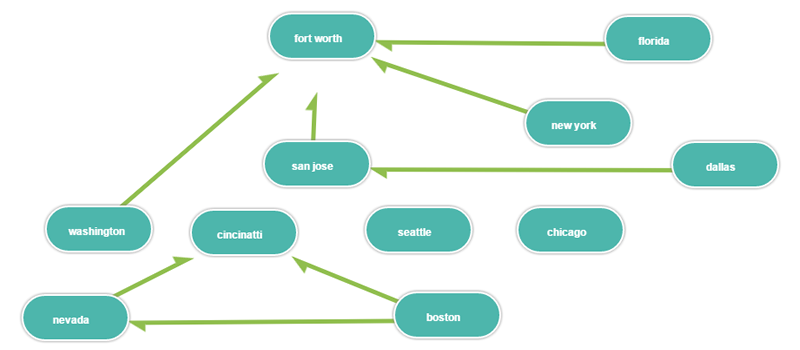
I had an idea to look for some JavaScript libraries to represent some tree like relations in HTML5. But most of my searches ended in libraries that can connect between two nodes, I needed a node to be able to connect 0 to many nodes.
It was then that I came across a JavaScript based project by @MattKing17 in github. I had a look at the code from that repo and could see that some optimizations could be made.
So in my spare time, I went on to heavily edit the source code, throw in a couple of new features and stylize the visual elements. I made a mistake of doing all this in private on my hard disk with a copy in my Google Drive. Now that I could add the final polish, I decided to push the code to GitHub.
So without further delay head over to https://github.com/midhunhk/moon-shine if you want to take a look.
What we have here is a base code for representing hierarchies and I will most probably fork this repo for each idea that I want to visualize. Here are a list of things I need to research i norder to create some visualizations with this repo.
- Different SubGenres of Rock
- Major Car Manufacturing companies in the world